Getting started with DracalView: Dracal graphical user interface software
When you order a USB measuring instrument from Dracal Technologies, you gain free access to a range of software tools. One of these tools is DracalView, the graphical user interface. Discover how to view and record your measurements as soon as you receive your instruments. For a more exhaustive list of the software's features, please consult the DracalView user guide.
- 1. Download the Software
- 2. Connect an Instrument
- 3. Launch DracalView
- 4. Verify the Instrument Appears in the Sources Tab
- 5. Modify Units and Decimals (Optional)
- 6. Customize the Names of Channels to Record (Optional)
- 7. Visualize Data on GraphView
- 8. Initiate the Logging Task in the Logging Tab
- 9. Keep an Eye on Data with BigView
- Conclusion
1. Download the Software
On the Software page, you'll notice that you can use DracalView regardless of your operating system (Windows, MacOS, or Linux). Download the latest version of DracalView compatible with your operating system.
Note: Under Linux, the software must also be compiled. See the startup guide here. 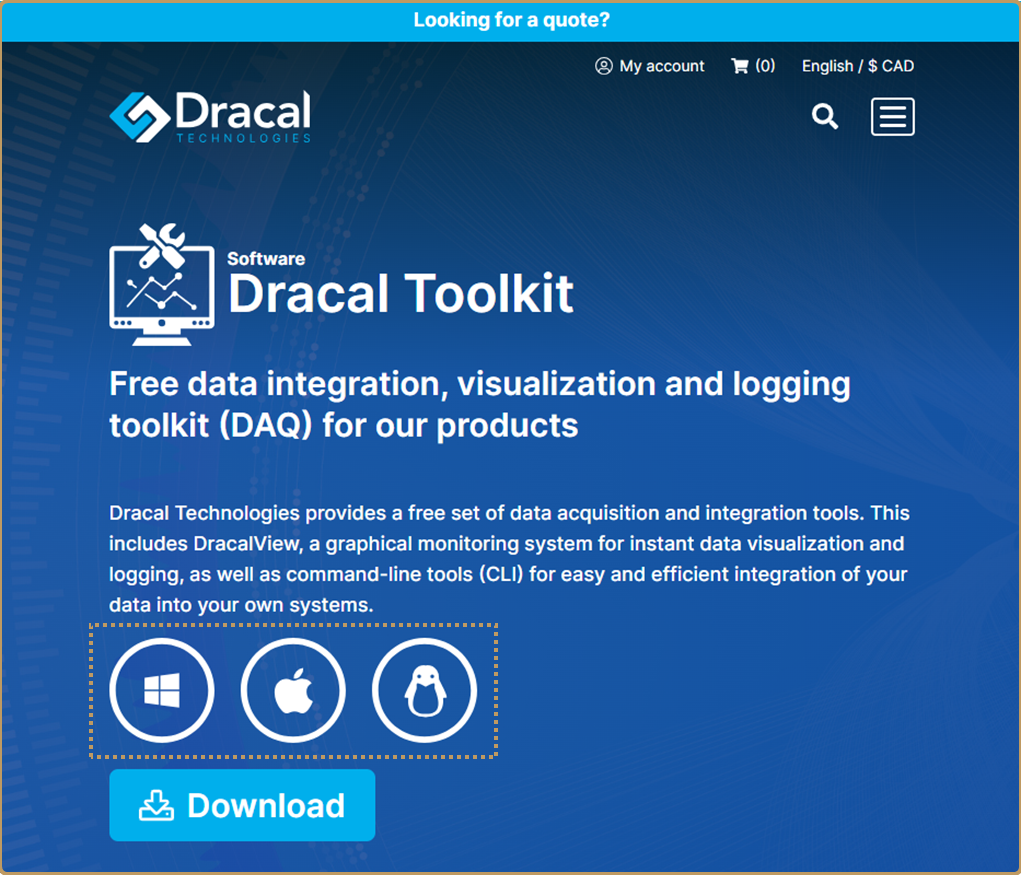
2. Connect Your Instruments
All Dracal Technologies instruments are delivered in USB mode, even if you choose a sensor with VCP option. You can plug them into a USB port on any computer. For demonstration purposes, we will use a single USB-TRH320-CAL, but the software supports an unlimited number of instruments of all types.
3. Launch DracalView
It's important to have the instrument connected before launching the software so that it recognizes the connected USB sensor.
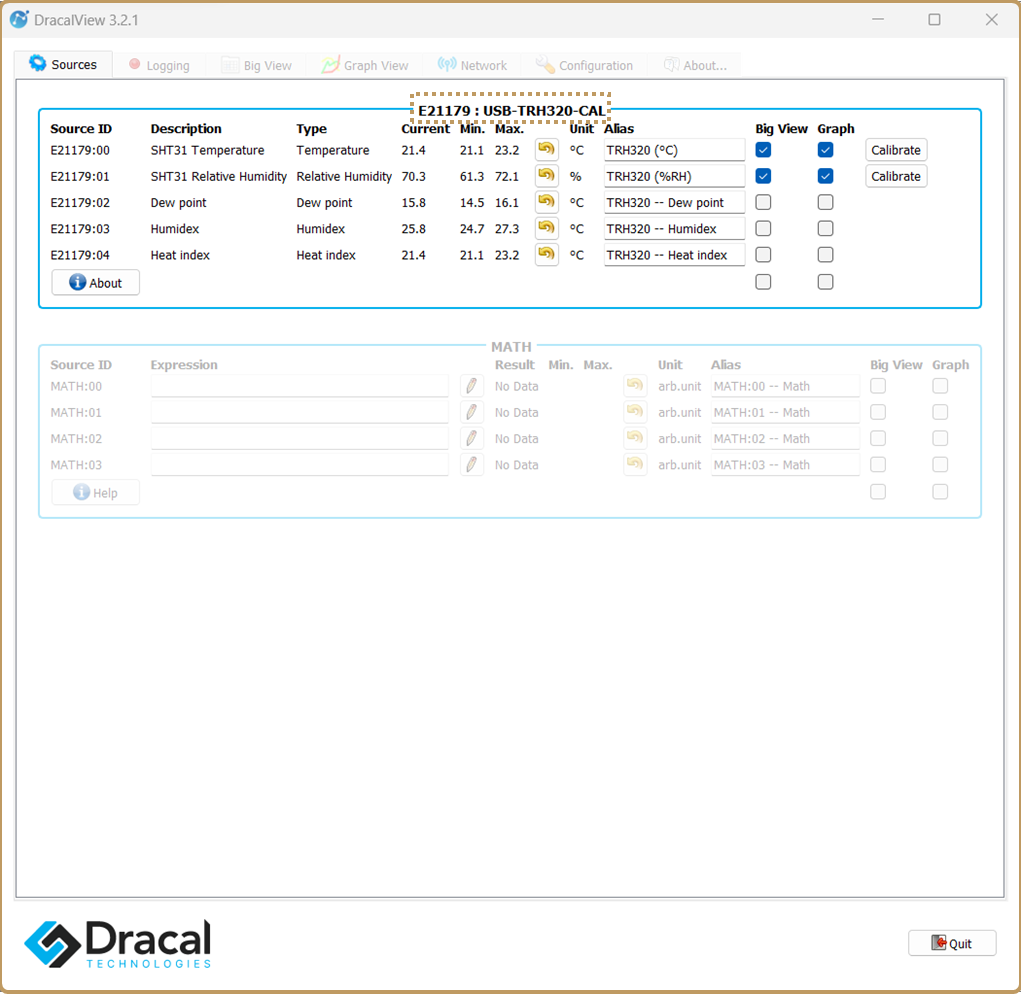
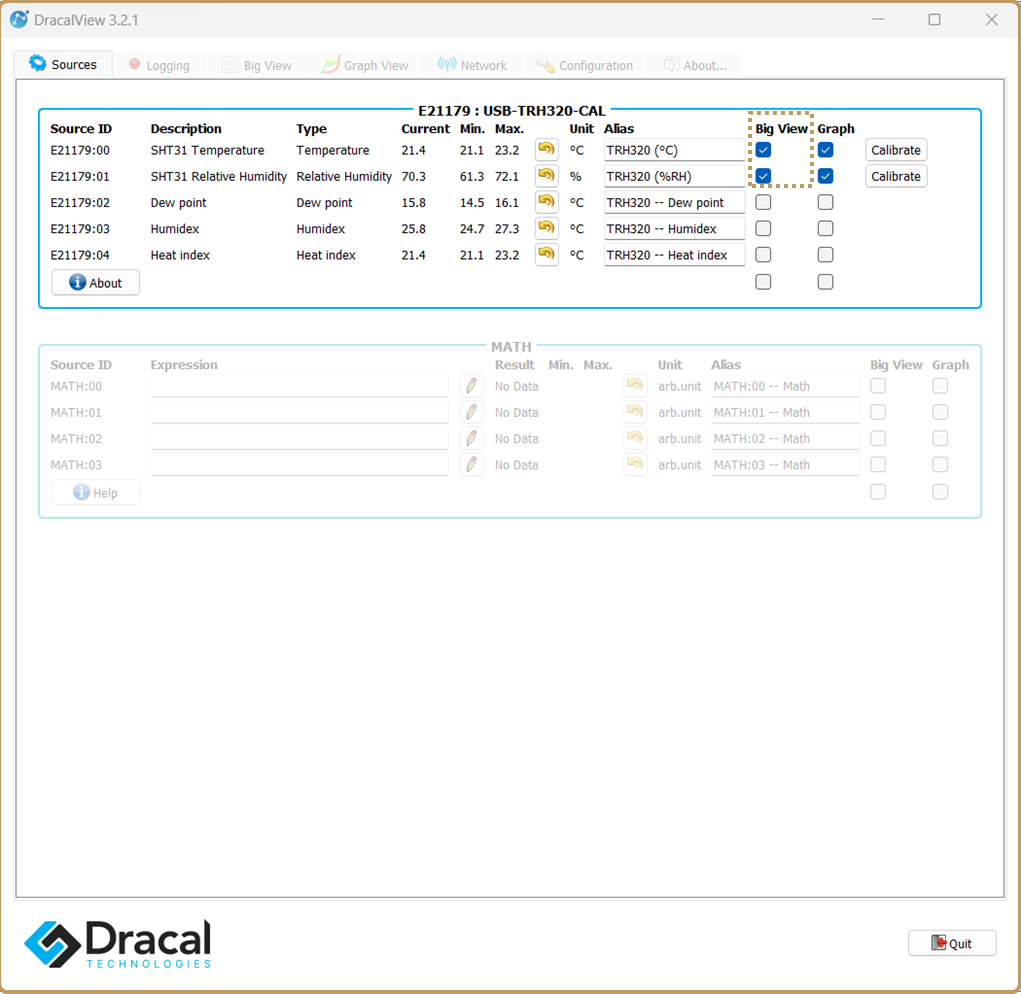
4. Verify the Instrument Appears in the Sources Tab
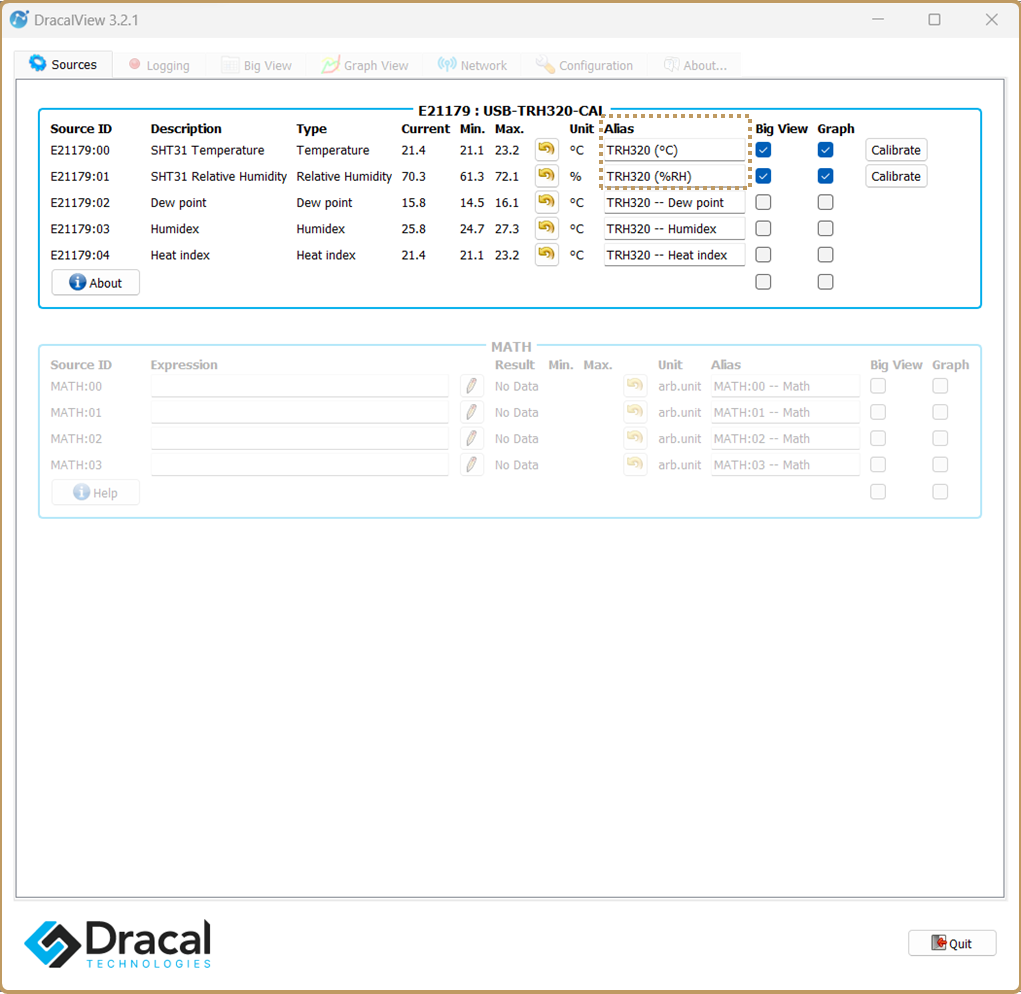
The home tab of DracalView is called Sources. When an instrument is recognized, it appears under this tab in a box with its name (USB-TRH320-CAL) and serial number (E21179), as illustrated in the image below. The available channels, as mentioned in the product datasheet, are listed in the blue box under the sensor's identifier.
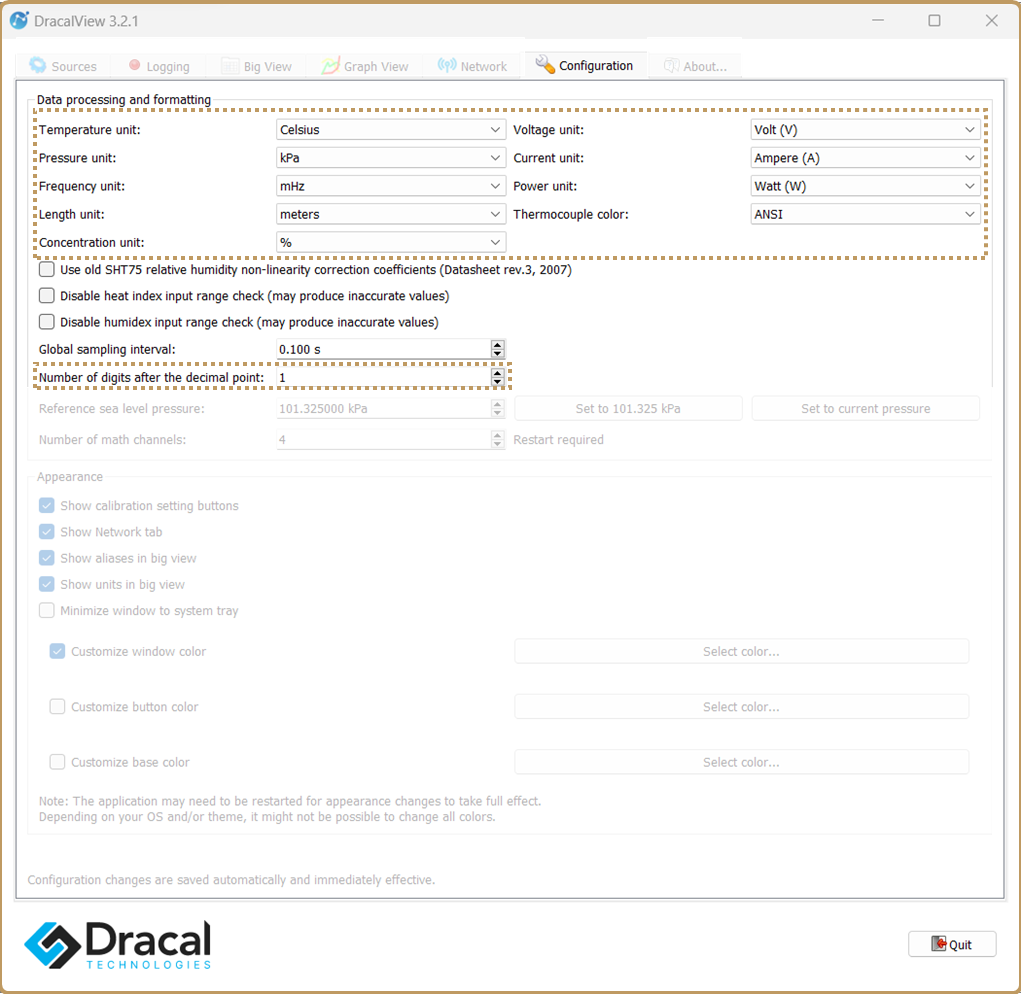
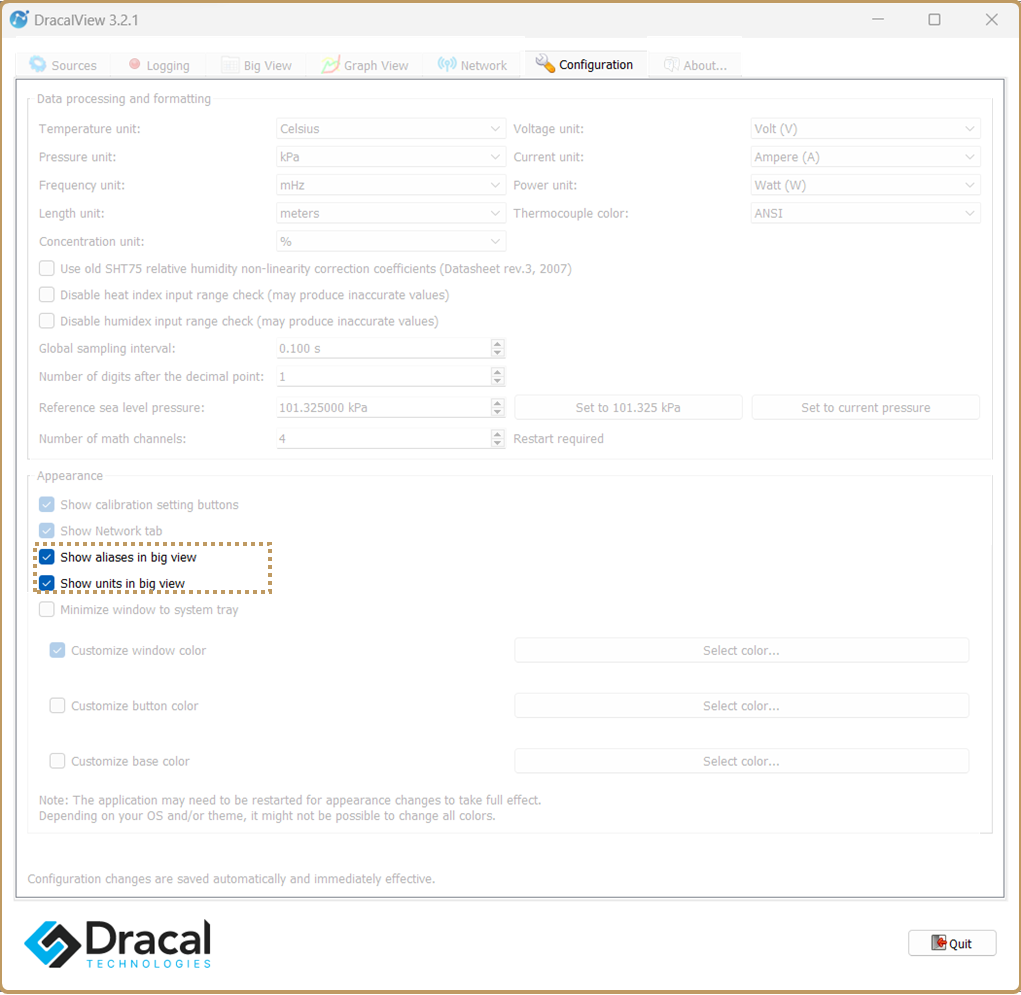
5. Modify Units and Decimals (Optional)
Do default units not suit your needs? Go to the Configuration tab to make necessary adjustments, both for units and decimals or other options.
Note: With SensGate, it's also possible to change units after the logging task.
6. Customize the Names of Channels to Record (Optional)
If you want to give more meaningful names to the channels to record, type the desired Alias in the Sources tab.
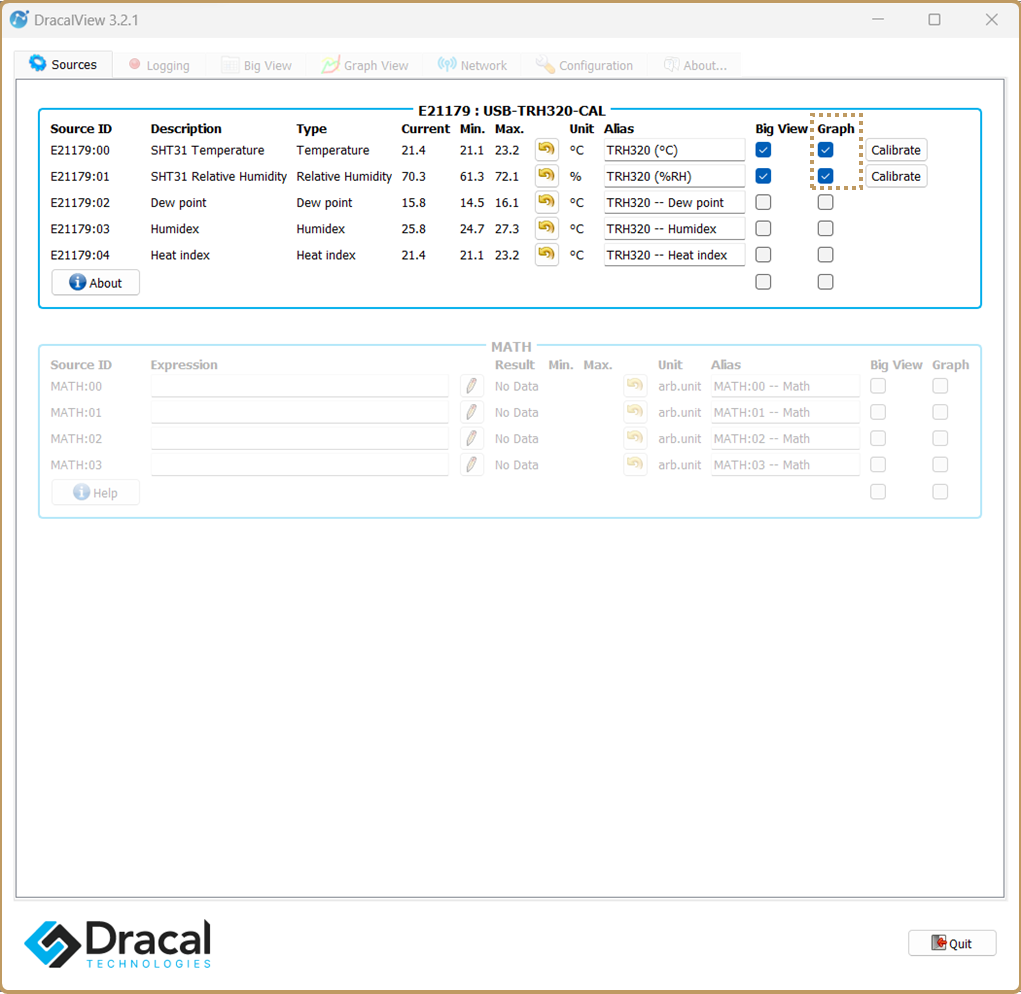
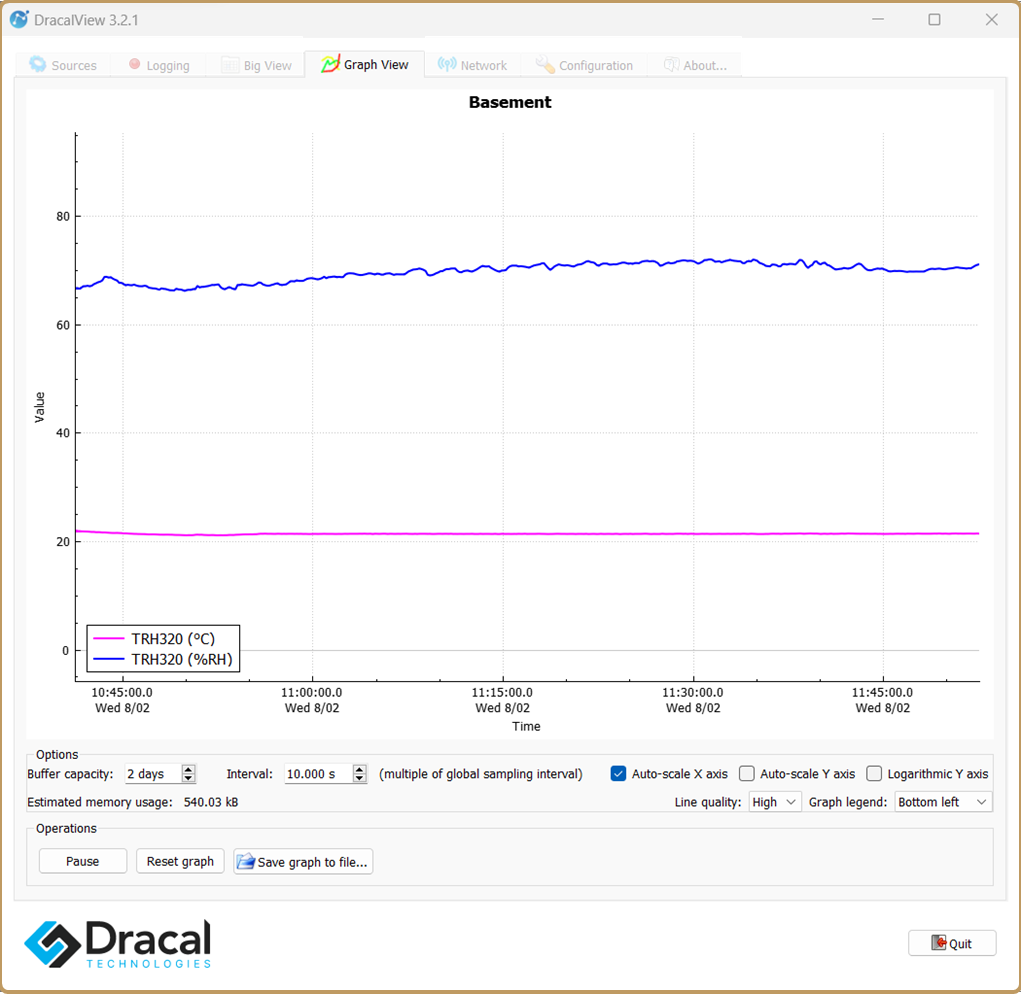
7. Verify Data on GraphView
If you want to see measurement stabilization before data collection, you can choose to graphically display the data by selecting the appropriate checkbox under the Sources tab and then clicking on the GraphView tab. This tab also allows you to visually follow the measurements without necessarily wanting to record them.
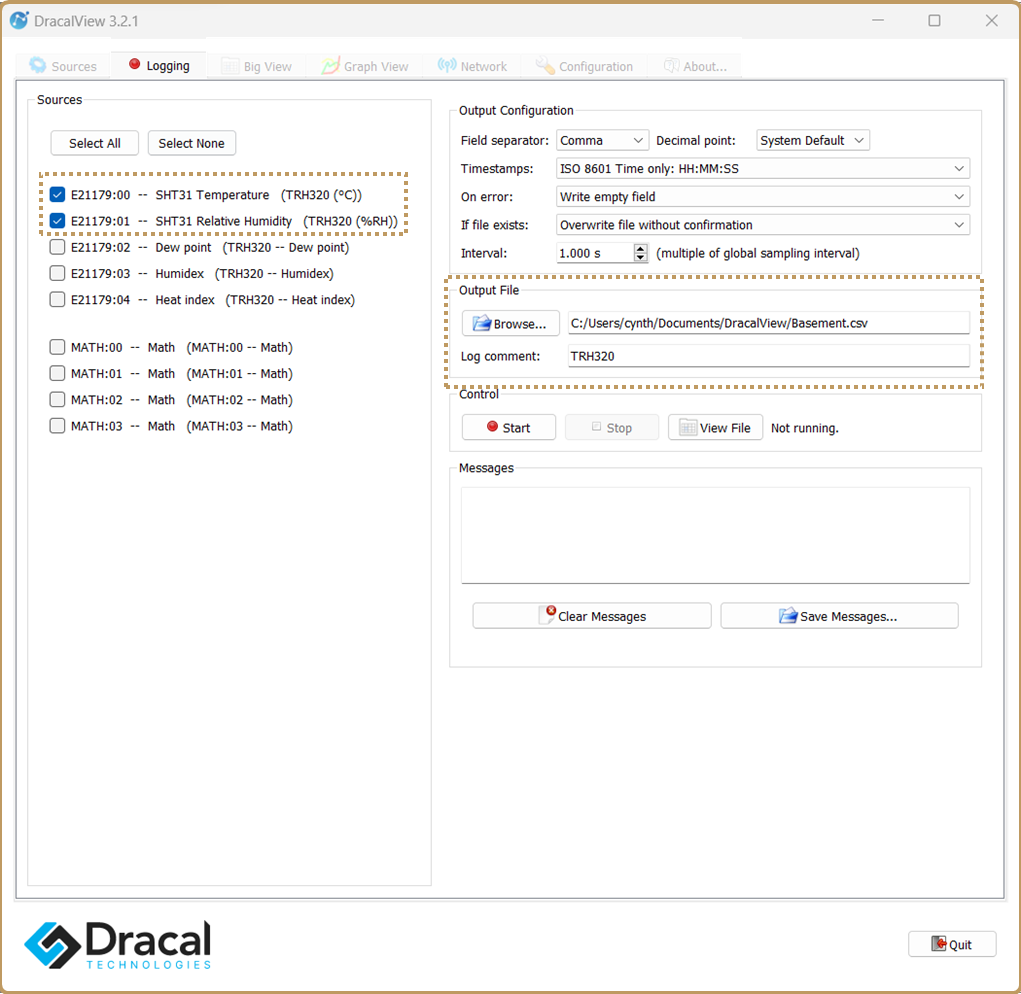
8. Initiate the Logging Task in the Logging Tab
When you're ready to start recording, go to the Logging tab, select the desired channels, determine the location of the recorded file, and click Start.
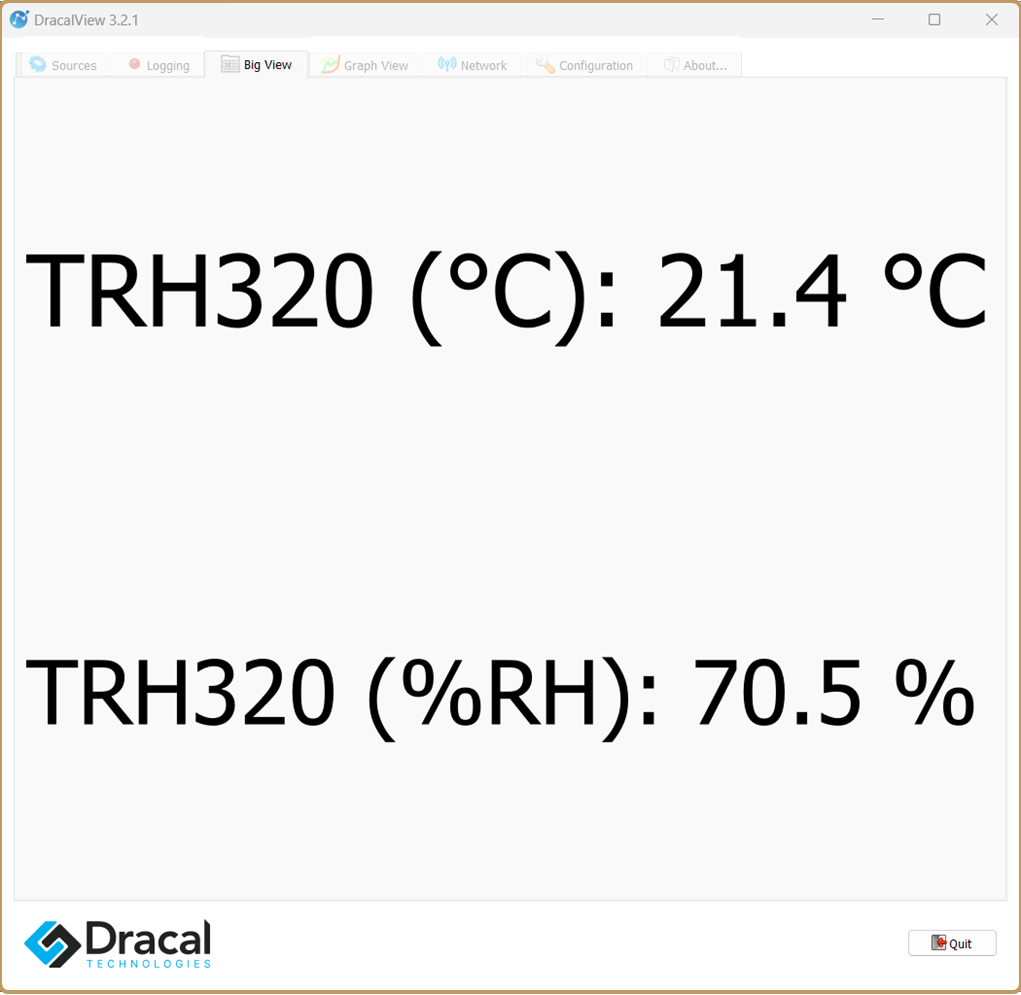
9. Keep an Eye on Data with BigView
If you want to quickly monitor measured parameters, you can do so by first going to the Sources tab, then selecting the boxes associated with BigView. Then navigate to the BigView tab.
Note: From the Configuration tab, you can choose to display aliases and units in BigView, greatly facilitating tracking multiple parameters at once.
Conclusion
In summary, 5 steps are required to initiate a logging task with DracalView, only involving 4 clicks once the software is open:
-
Click 1 on "Logging tab"
-
Click 2 on "Select All"
-
Click 3 on "Output file" (enter the file name)
-
Click 4 on "Start"
In addition to logging, DracalView allows you to graphically or instantly monitor your measurements in real time, making Dracal's solution a portable DAQ system.
If you want to see the software in action, we recommend a series of video tutorials created to guide you through it, including this one that covers it in less than 3 minutes.