How to combine math channels and graph view features
We want to generate an image which shows the fluctuation of ambient temperature in Celsius, and that of normal atmospheric pressure in kPa, by offsetting the pressure. To do so, we will need to use a combination of the mathematical channels and configuration features in the Graph View tab.
Before anything, note the atmospheric pressure's minimal and current values.
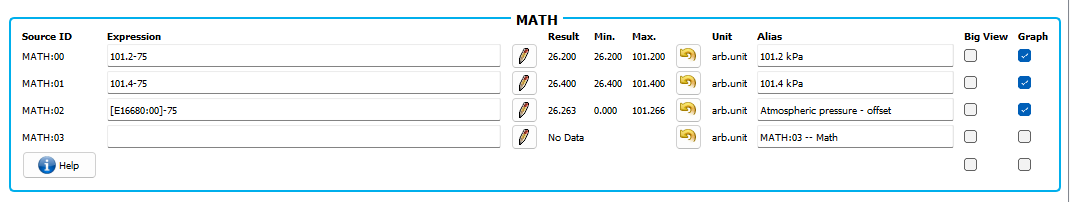
Step 1: Type the minimal value of the atmospheric pressure in Math channel 0, and change the alias to its value.
Step 2: In Math channel 1, type the upper value of the atmospheric pressure, typically 0.2 kPa greater than the minimum value.
Step 3: In Math channel 2, enter, in square brackets, the identifier of the atmospheric pressure channel.
Step 4: Type ‘minus 75’ next to the expression already entered in the three math channels. This will offset the atmospheric pressure to be visible along with the temperature.
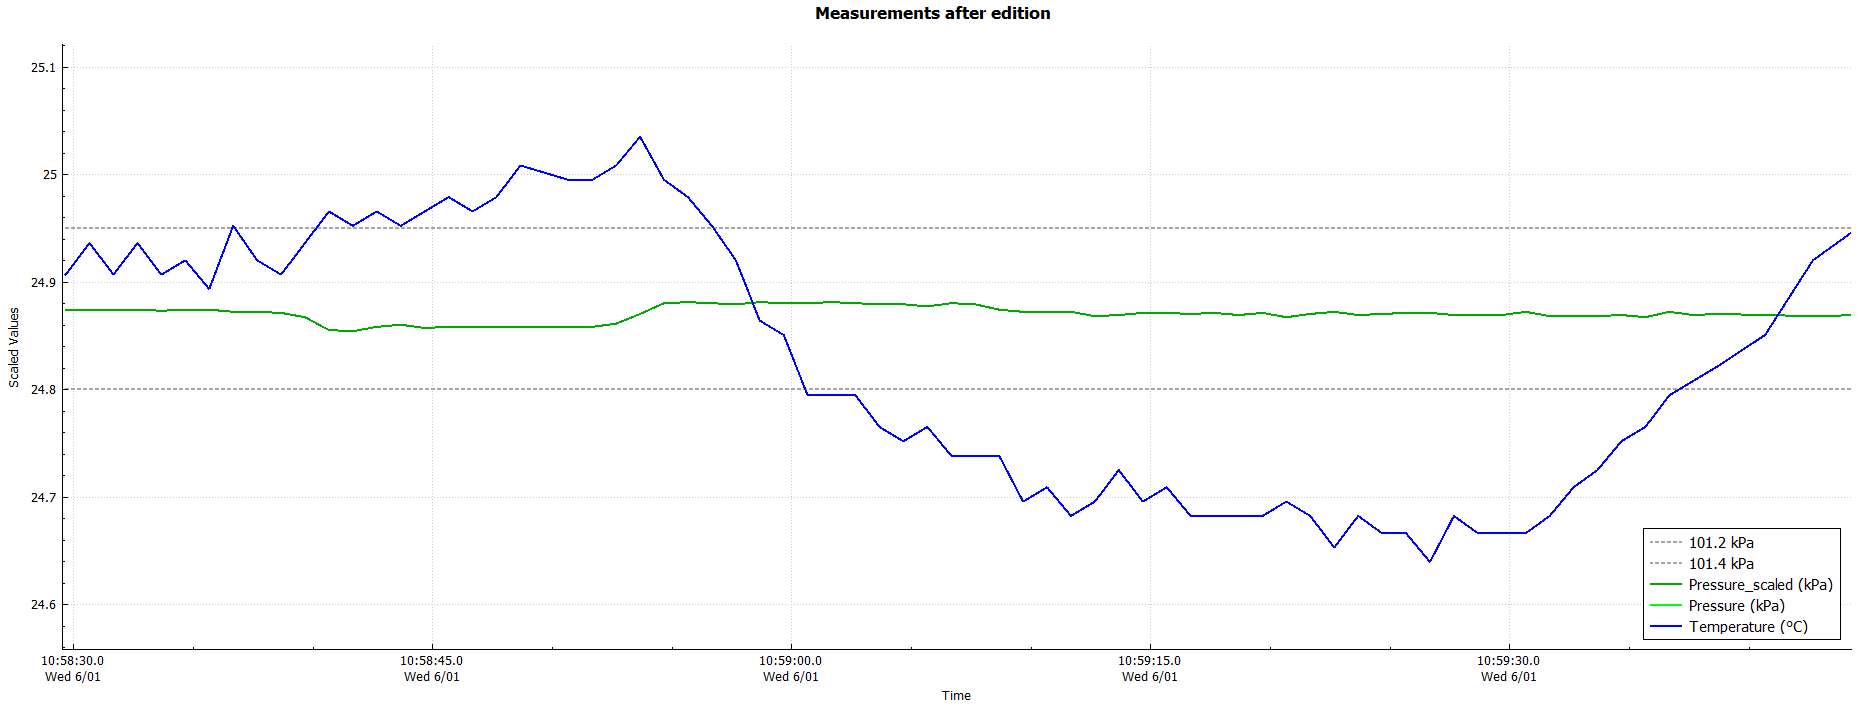
Step 5: In the Graph View tab, change the Y-axis zoom and you will now see the fluctuation of the temperature, as well as that of the air pressure, between the minimum and maximum values observed.
Step 6: Make sure the legend is appropriate, for example by changing the color and style of the lines. You can also change the title to make it meaningful.
If you wish to keep a copy, click on "Save graph to file..."
For more details, watch this short video tutorial.