Documentation of DracalView: Our free data visualization and logging software
You will find on this page the multiple functionalities of DracalView (download here), our free data logger software. The following documentation is based on version 3.0.0. Also available: a short video tutorial to get started with DracalView.
1) Sources Tab
Also available is a short video tutorial to see the Source Tab in action.
1.1) Overview
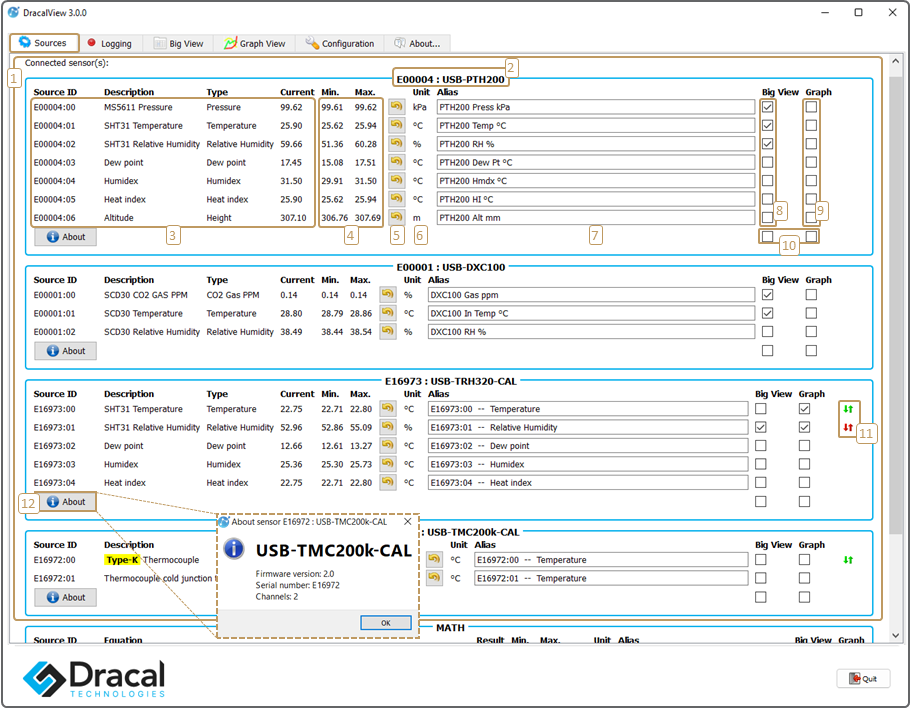
[1] Connected sensors.
You can have as many as you wish. In this example, there are four: E00004, E00001, E16973, and E16972.
[2] Sensor unique serial number, followed by its product name.
[3] Available channels from a sensor.
A channel is a unique measurement data stream. It can be real or virtual.
Real channels are direct outputs of physical measurements. Virtual channels are computed values based on real channels. Humidex is an example of a virtual channel.
[4] Minimum and maximum value encountered so far for a channel.
You can reset these values (see point [5]).
[5] Reset the minimum and maximum values encountered so far. Affects the values displayed in point [4].
[6] Measurement units.
Measurement units can be modified in the Configuration tab.
[7] Name you want to use for a channel.
[8] Channels you want to see in the Big View tab.
[9] Channels you want to see in the Graph View tab.
[10]Check/uncheck all.
[11]Indication of the presence of calibration points on calibratable instruments. See section 1.2) of the present documentation for more information about calibration management.
[12]General information about the sensor.
1.2) Calibration Management
Also available is a short video tutorial to see the calibration feature in action.
Important Note: Dracal sensors featuring both the VCP and CAL options can only be calibrated with DracalView software versions 3.2.0 and newer. However, once calibrated, these instruments will return their correctly calibrated values with any software version from 2.1.17 and later.
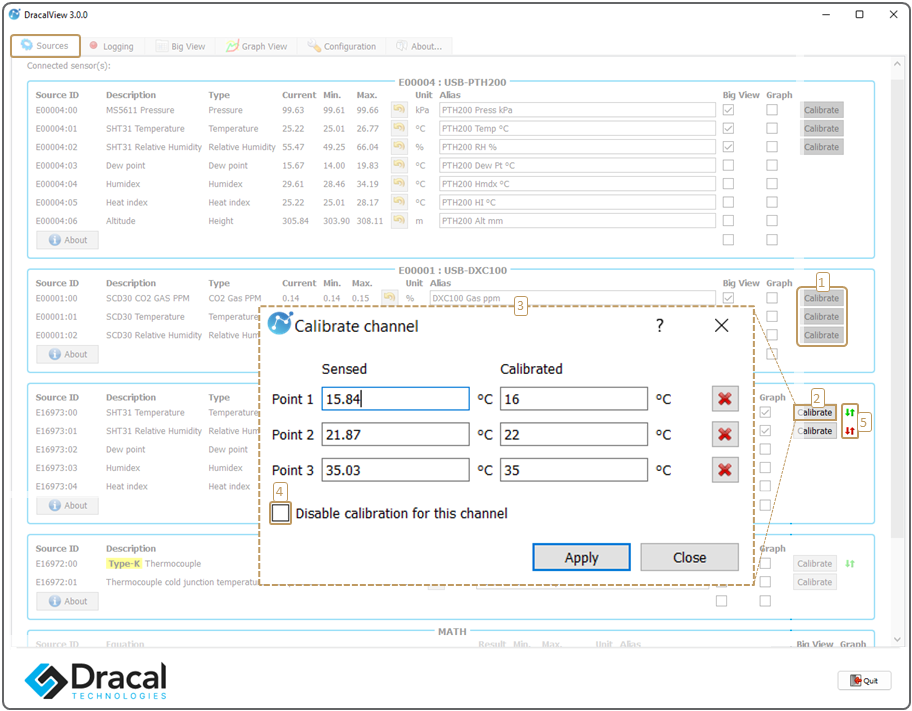
[1] Buttons to manage calibration points.
Here, the buttons are grayed out as the USB-DXC100 product is not calibratable (does not have the suffix "-CAL" in its product name).
The same is true for the calibratable products' virtual channels. The Configuration tab allows you to choose whether or not to display the calibration buttons (see section 5 point [9]).
[2] Buttons to manage calibration points, on a calibratable channel. This one is not grayed out.
[3] Calibration point management window.
[4] Option to enable or disable calibration, applying only to data generated by DracalView.
It is important to note that even if this box is checked, the calibration points remain stored inside the sensor.
Thus, for users wishing to access their data with our command line tool dracal-usb-get, it is important to note that the calibration will not be disabled in dracal-usb-get.
[5] Indicator of the presence of calibration points.
The presence of green arrows indicates that calibration points are recorded and that the calibration is activated.
Red arrows indicate that calibration points are recorded, but the calibration is disabled.
No arrows indicate that no calibration points are recorded.
See the documentation of dracal-usb-cal to calibrate your sensors from a terminal with our command line tool.
1.3) Sources Tab: MATH Channels
Also available is a short video tutorial to see the Math channels in action.
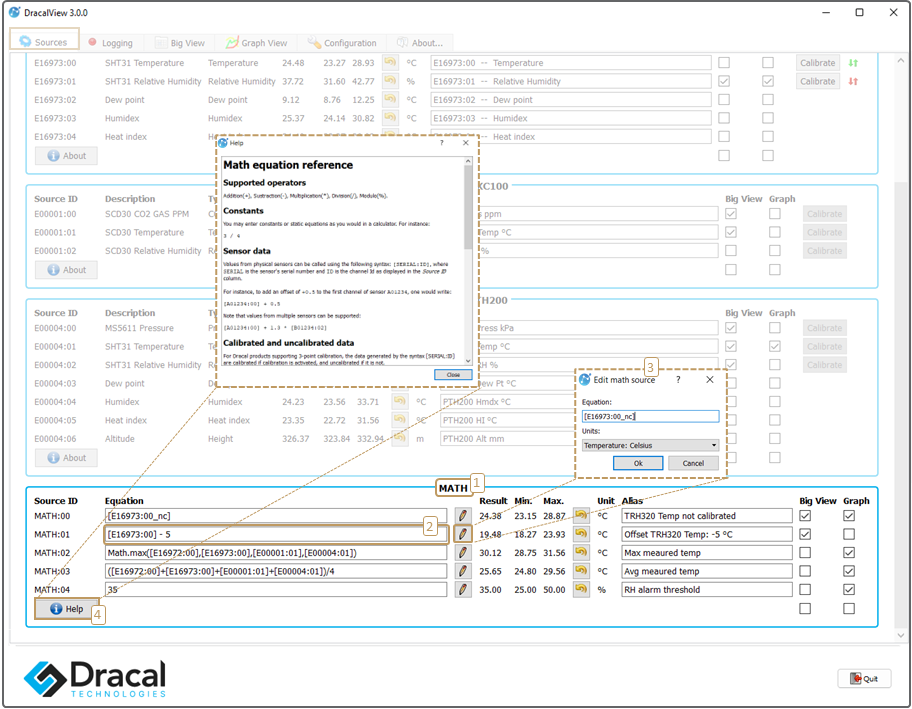
[1] Mathematical channels.
[2] Edit the formula.
Use the form [SourceId] to refer to a sensor channel in a formula (e.g., [E00001:00]).
[3] Click "Edit" to define the channel's unit and edit the formula.
[4] Get started with examples and tips.
2) Logging Tab
Also available is a short video tutorial on how to see the Logging tab in action.
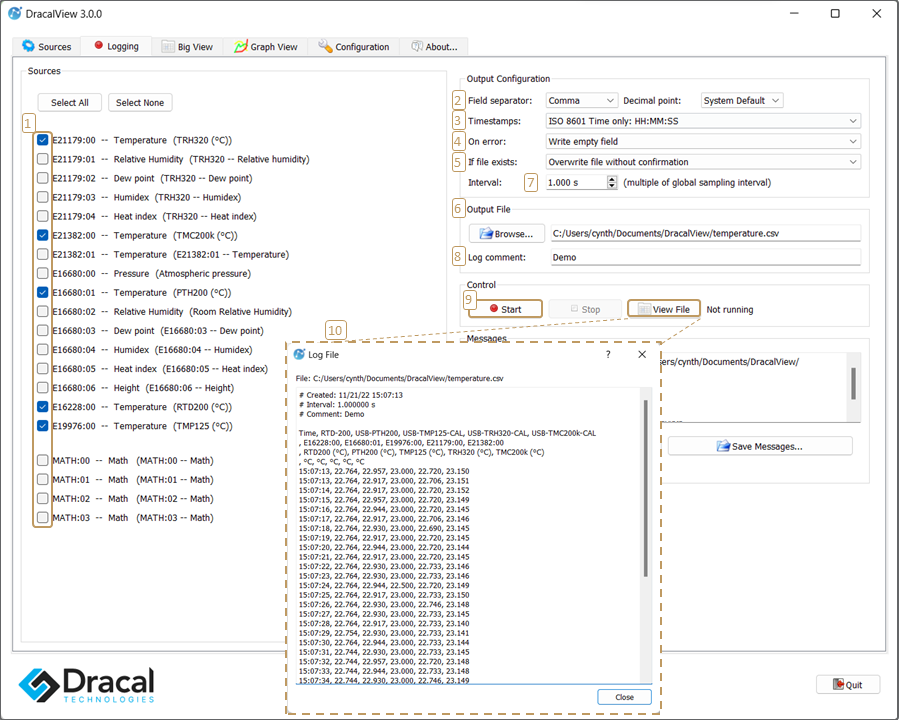
[1] Select data to log.
[2] Configure the logging file format.
[3] Define the timestamps format.
[4] Decide how to detect errors in the file.
[5] Decide what to do if the file in [6] already exists.
You can overwrite it, but you can also append the new data to the existing file.
[6] Choose/create the destination file.
[7] Decide the data recording frequency.
[8] Include a comment in the header of the recording file.
If you decide to append several subsequent recordings to the same file, this option is useful for specifying what differs between them.
[9] Start/stop logging.
[10]Click on View file to see real-time file writing.
3) Big View Tab
Also available is a short video tutorial to see the Big View Tab in action.
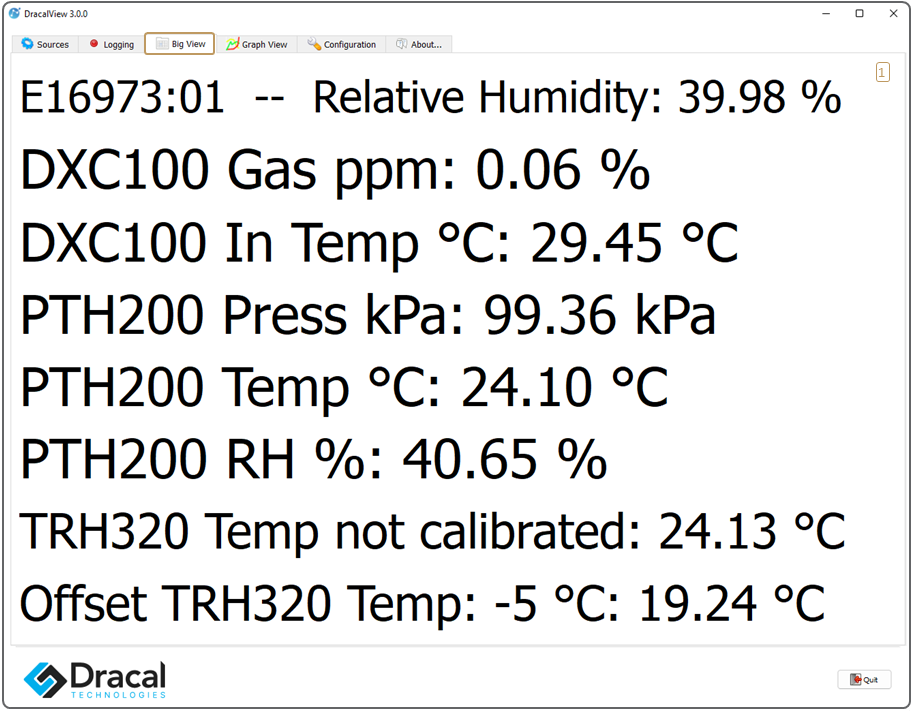
[1] Displaying data channels under their alias name as defined by the user in the Sources tab.
Channels to display are selected in the Sources tab in the Big View (Sources point [8]) column.
Go to the Configuration tab (points [10] and [11]) to decide whether the units and/or the aliases should be displayed.
4) Graph View tab
Also available is a short video tutorial to see the Graph View Tab in action.
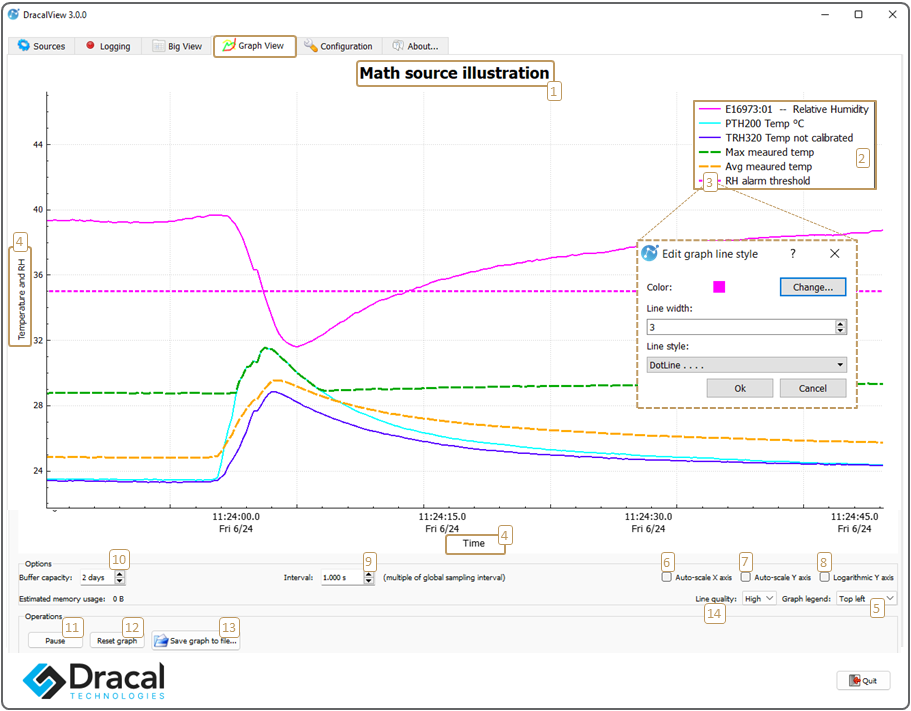
[1] Click once to edit the graph name.
[2] The legend.
The channels to be viewed are selected in the Sources tab in the Graph (Sources point [9]) column.
Data channels are identified with their alias name as defined by the user in the Sources tab.
Change the legend position in point 5 below.
[3] Click once on the line to edit its colour and style.
[4] Click once to edit the axes name.
[5] Change the position of the legend.
[6] Check this box to view all the available data up to the current time.
Uncheck it to zoom in or out.
Tip: To zoom in the x-axis direction only, uncheck this box and check the Auto-scale Y-axis box (point [6]).
[7] Check this box to fix and set the y scale to visualize all your curves simultaneously.
Uncheck it to zoom in.
Tip: To zoom in only in the y-axis direction, uncheck this box and check the Auto-scale X-axis box (point [5]).
[8] Use a logarithmic scale in the Y-axis.
[9] Set your sample interval. The minimum is 100 ms.
This value should be greater or equal to the sensor sampling loop (Configuration point [5])
[10]Total available display time.
The display follows a first in, first out rule: the oldest data points are the ones to disappear.
To visualize your data over a longer time period, you can either increase the sample interval (point [9]) or use a logging file (Logging tab) to export the data to graphing software.
[11]Pause data display.
Pausing then unpausing does not generate a gap in the graph. The data starts to be displayed again directly after each other.
Note: Pausing on this tab does not affect data logging in the Logging tab.
[12]Clear the graph.
[13]Save graph to file (many formats available).
[14] Select Low-line quality to decrease the memory needed to generate the graph by half.
5) Configuration Tab
Also available is a short video tutorial to see the Configuration Tab in action.
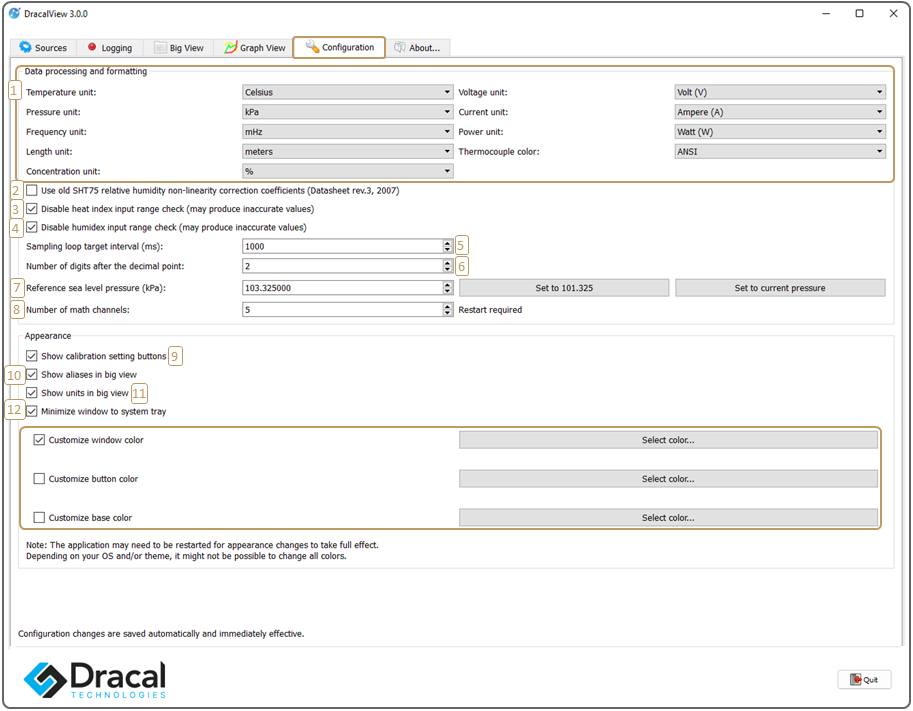
[1] Change the units for each type of measurement.
[2] Support previous humidity compensation formula for older products.
[3] When unchecked (the default), heat index virtual channels validate whether the temperature and humidity measurements (on which the heat index formula is based) are within the accuracy range to return a correct value. If not, heat index channels output "out of range."
Check this box to always have a heat index calculated value, even when outside its accuracy operating range.
[4] Similar to point [3] above, applied to virtual humidex channels.
[5] Minimum time given to DracalView to complete one update of every sensor data. For the use of a large quantity of sensors, a higher value can be imposed to ensure a complete update of all data. If all sensors cannot be polled within the allocated period, the displayed value will be identical to the last recorded value.
[6] Number of displayed digits.
[7] Sea level configuration.
[8] Decide if aliases should be displayed in the Big View tab.
[9] Decide if unit calibration management buttons should be displayed in the Sources tab.
[10] Decide if units should be displayed in the Big View tab.
[11] Check this box if you want to see only the access icon in your system tray when you minimize the DracalView window and not in your toolbar.
[12] Personalize your DracalView window. In this documentation, white has been imposed as the window colour (gray is the default option).
6) Network Tab (Essential for the SensGate)
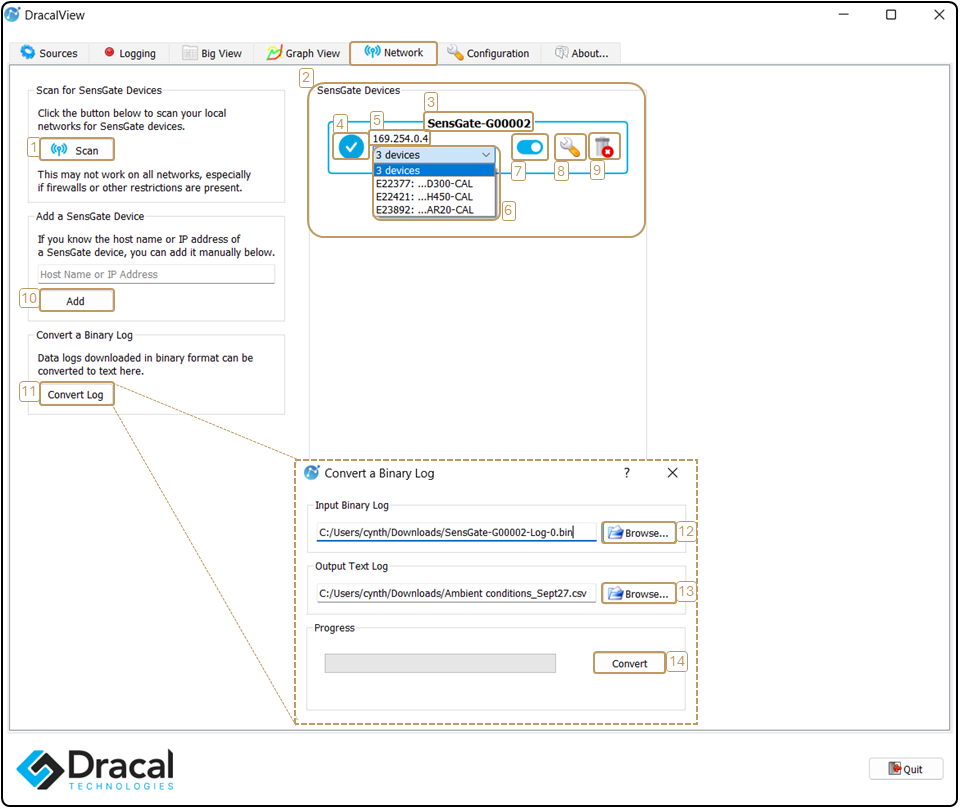
[1] A scan button is used to discover the SensGate(s) connected via USB or already associated with the same network as the computer.
[2] List of SensGates found on the network.
[3] Name of the discovered SensGate.
Tip: It is possible to rename the SensGate. See the procedure.
[4] An icon indicating that the SensGate is connected to DracalView.
[5] The IP address of the discovered SensGate.
[6] Serial numbers of the three sensors connected to the SensGate.
[7] The selection tool to view the sensors connected to the SensGate in the Sources tab of DracalView.
[8] Button to open the access page of the SensGate in your default browser.
This allows configuring the SensGate, for example, to connect it to a Wi-Fi or Ethernet network and launch data logging tasks with files stored on the SensGate.
[9] The button will delete the discovered SensGate until the next scan.
[10] If you know the IP address of your SensGate (see number [5]), and the "scan" button does not find it, you can add it manually by entering the IP address and clicking this button.
[11] Once the logging task is complete, if saved on the SensGate, you can download the data in binary mode (uncorruptible file) and convert it into a .csv file with one click using this button.
- [12] Import the binary file.
- [13] Name the output file and its destination.
- [14] Click the conversion button.