How to change the scale of a channel with math channels?
![]()
DracalView allows you to view as many channels as desired on a single graph. While this feature, by its simplicity, allows you to quickly visualize channels of all types together, it can sometimes make it difficult to read channels for which measurements are taken on scales far apart.
Thankfully, math channels can quickly allow you to implement a scale change on any channel, so that it can be carried over to a similar scale to other measurements. Below we illustrate a few steps that will quickly allow you to view all your measurements on similar scales.
A little math
In the following, we want to plot the measurements taking place between real boundaries A and B on new boundaries C and D. For example, if we plot on the same graph a temperature that oscillates between A = 20 °C and B = 25 °C and the atmospheric pressure that oscillates between 100 kPa and 102 kPa, it will be convenient to create a math channel that allows us to view the temperature between the C = 95 and D = 99 boundaries, so that the measurements vary on a scale similar to atmospheric pressure.
To do this, here is the formula to implement in a math channel that scales the x channel:
scaled_x = (x-A)/(B-A)*(D-C)+C
Illustration
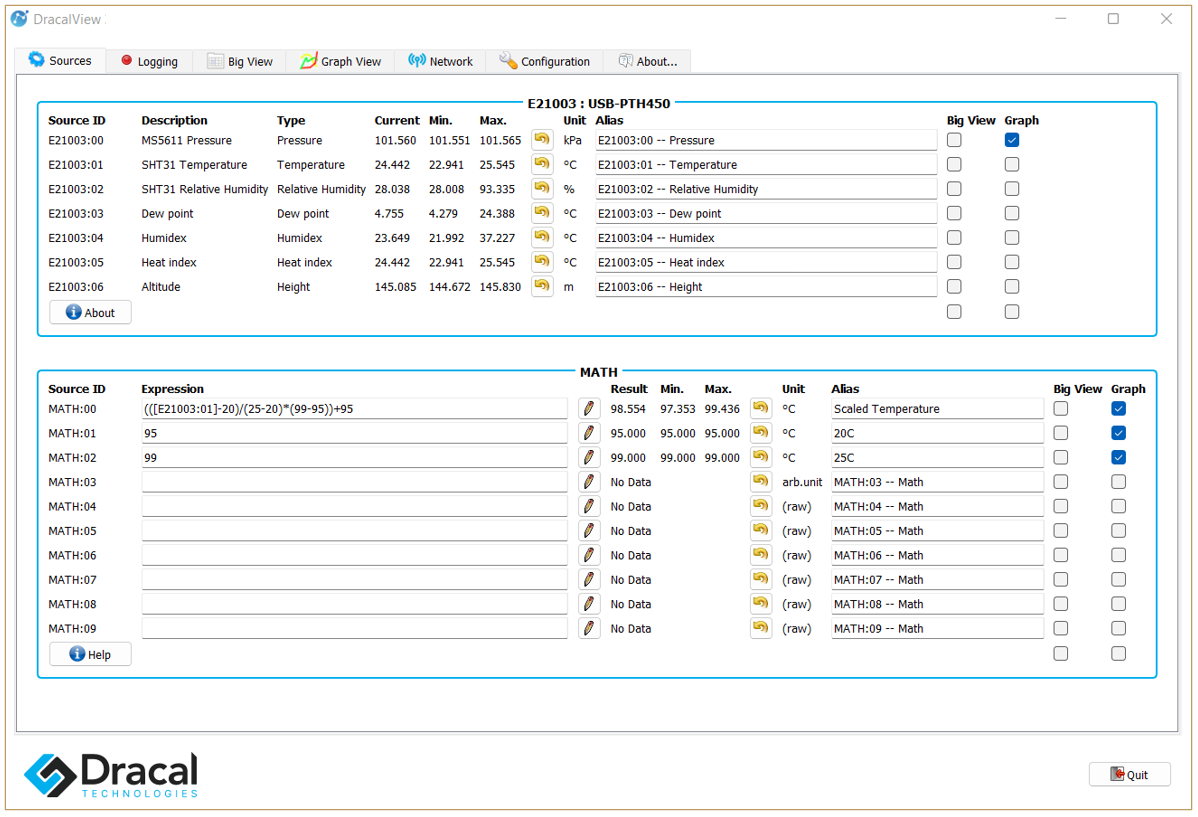
For example, if the temperature channel is the second channel of a sensor whose serial number would be E21003 (see image below), using A=20, B=25, C=95 and D=99 as discussed above, the formula to be entered in the math channel would be:
MATH:00 = ([E21003:01]-20)/(25-20)*(99-95)+95
with perhaps the alias "Scaled Temperature".
When applying a scale change via a math channel, we also recommend defining 2 other math channels to identify the equivalent boundary reference. For example here, as 20 °C becomes scaled to 95 and 25 °C to 99, it will be convenient to create the following two channels:
MATH:01 = 95 , with the alias "20 °C"
MATH:02 = 99 , with alias: "25 °C"
Here is an illustration of the application of this formula directly in the software, with a USB-PTH450 instrument whose serial number is precisely E21003 :
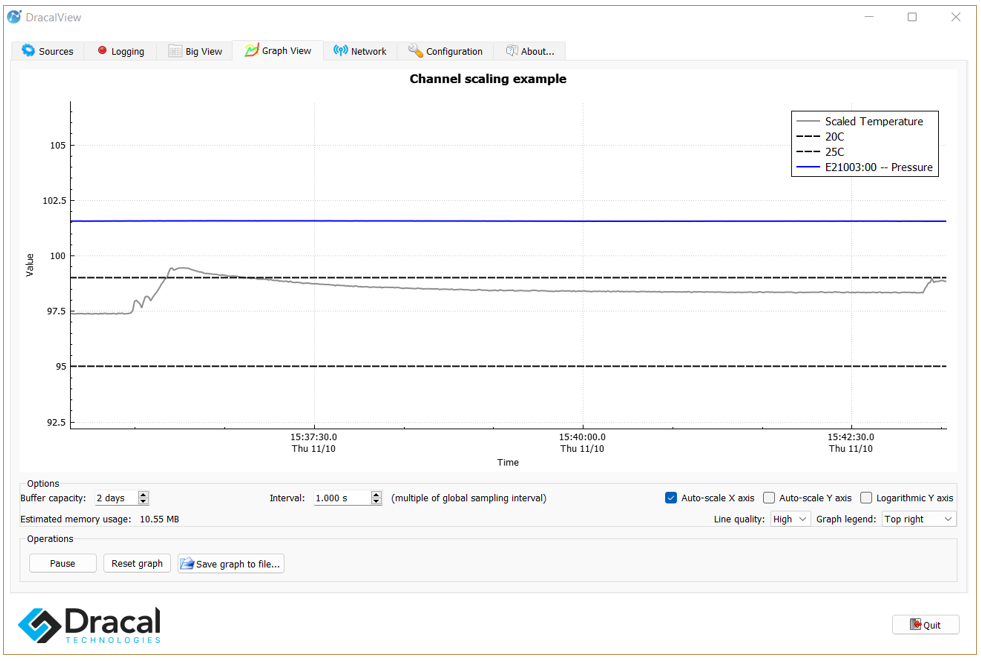
and the associated graphic view in the Graph View tab:
Two more tips
1) You may have noticed that in the Soure tab image above, 10 math channels are accessible. In fact, you can display up to 99 math channels via the Configuration tab (see point [8] here).
2) Again in the image on the Soure tab above, we have associated the units °C that were associated with the first three math channels. You can find out how to assign units to a math channel in point [3] here.
If you have any questions about this article or the use of the math channels, please do not hesitate to contact us.